2022-08-03
1 Background
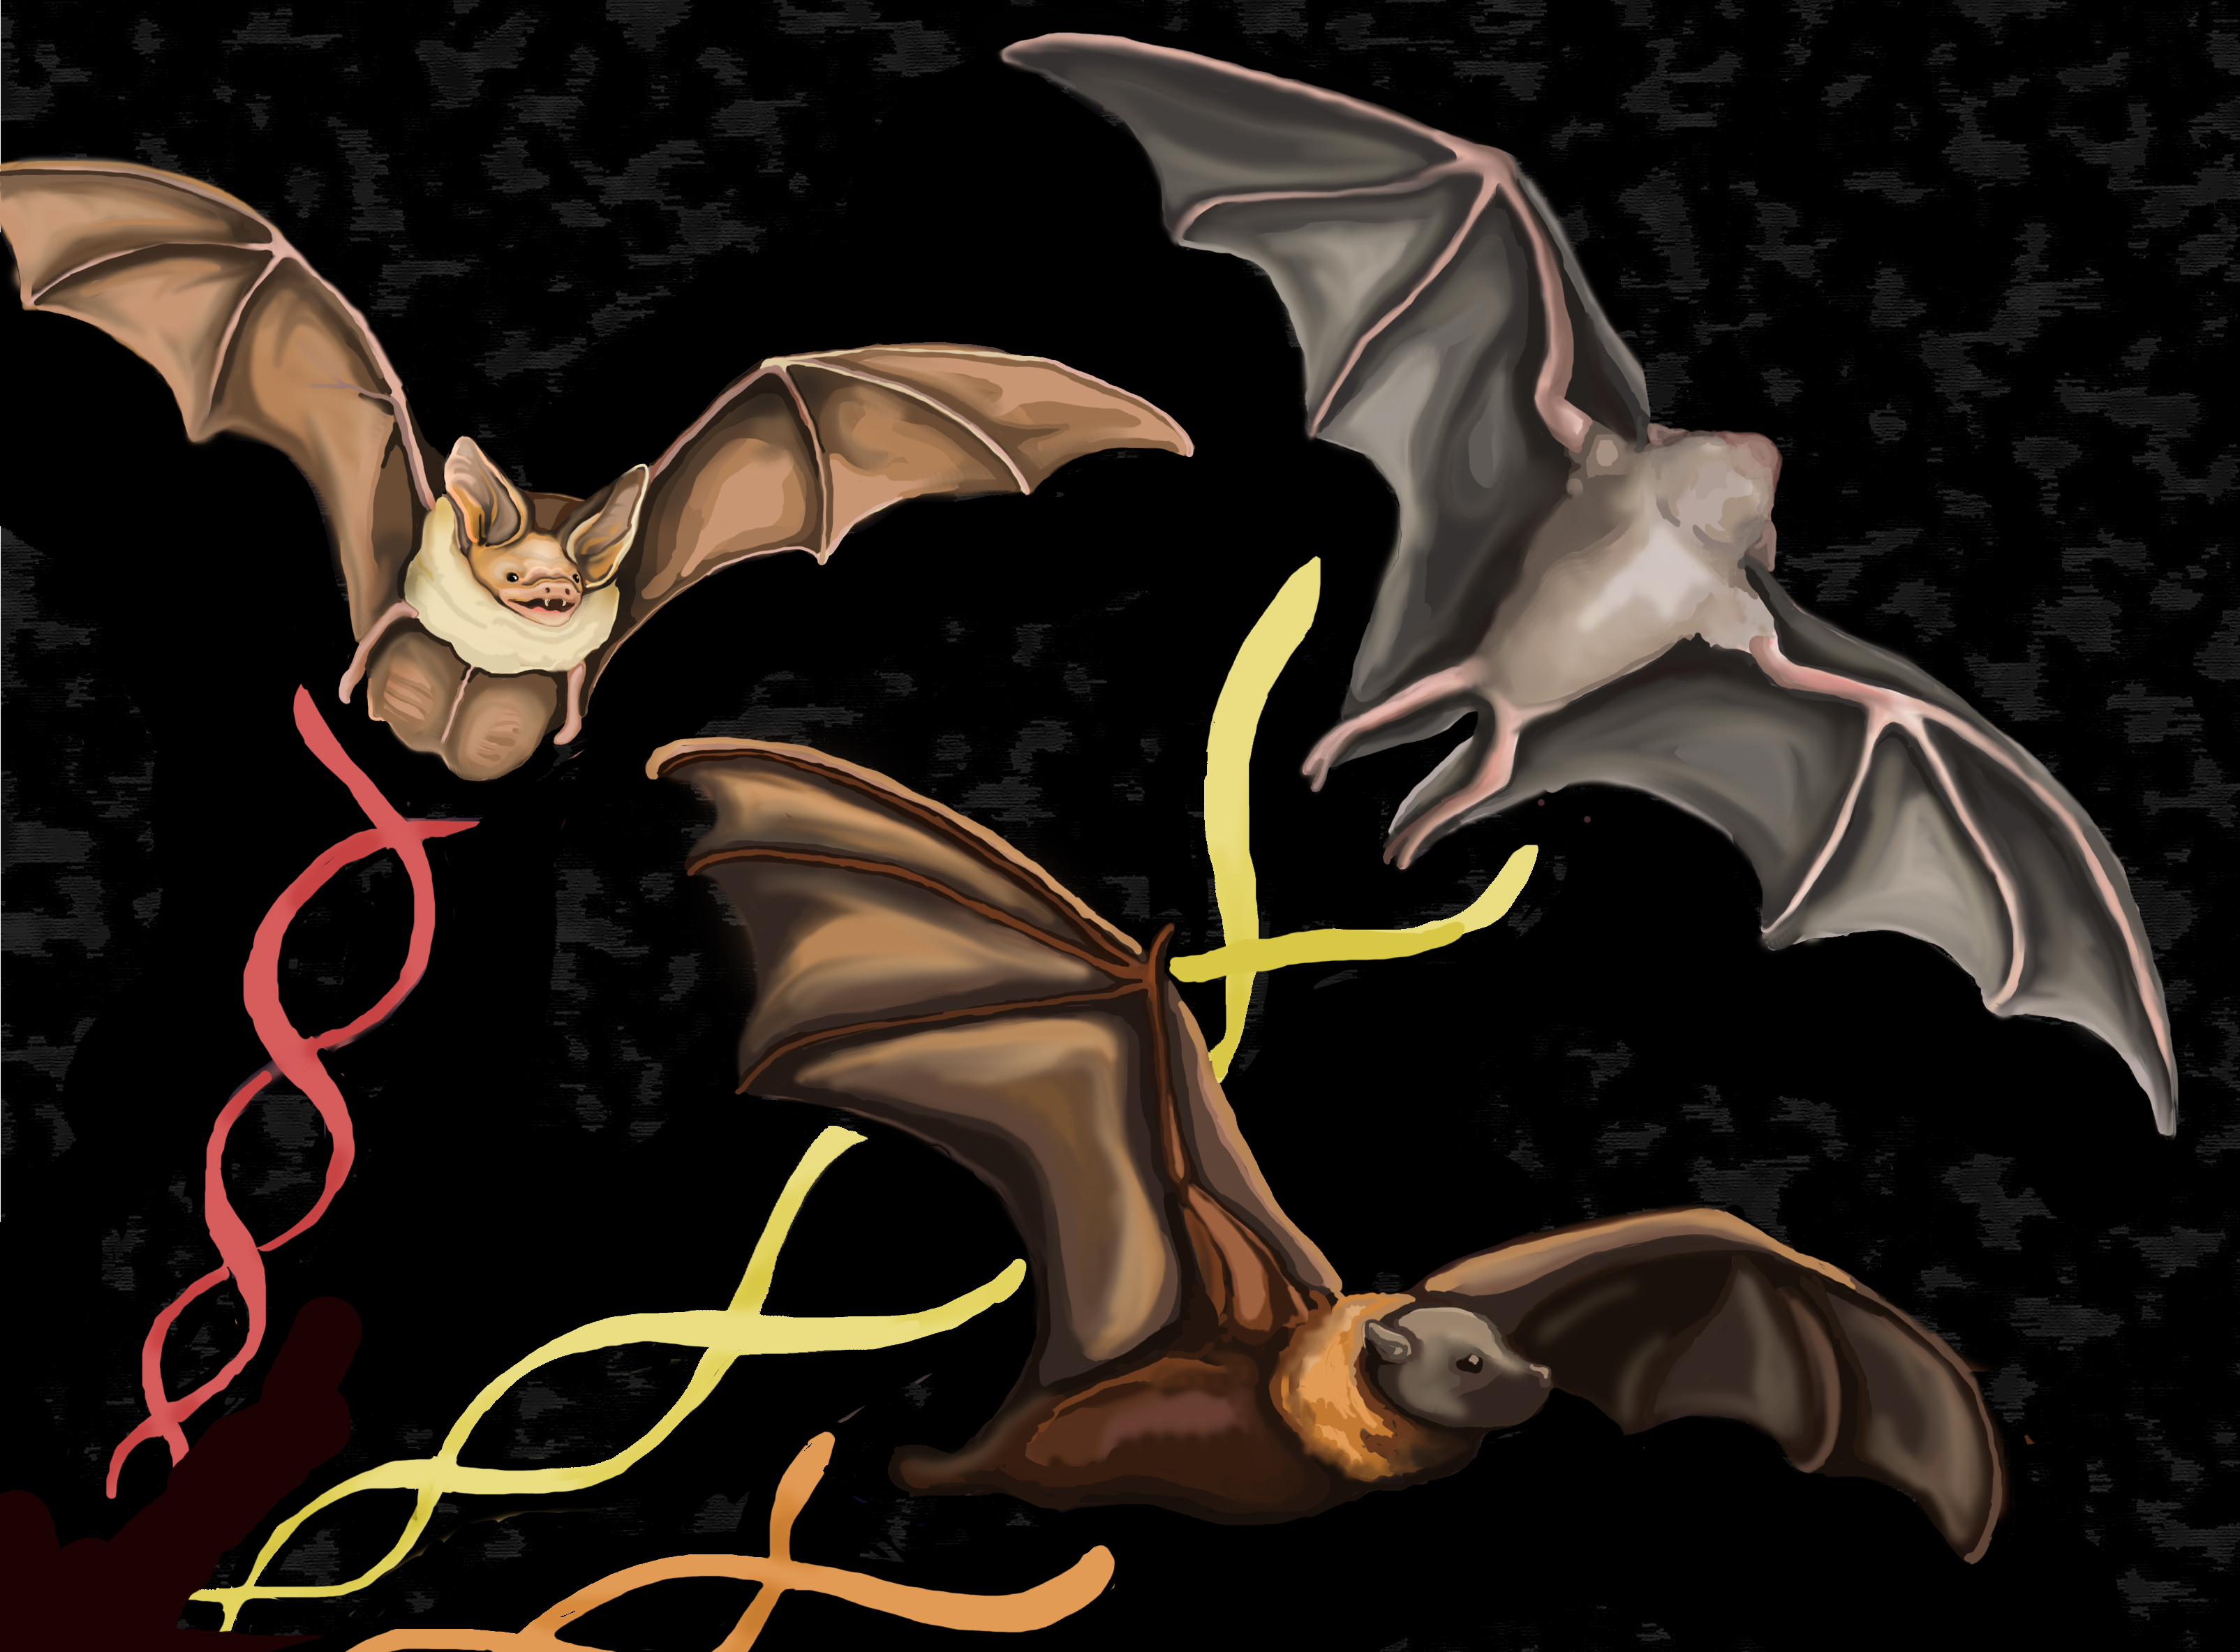
Genetic data are almost like a time machine. Just as paleontologists can use the fossilized remains of dead plants and animals to learn about species that once lived on our planet, geneticists can use genetic data to learn about the history of species that are currently living on our planet. At a basic level, this works for the same reason that people tend to resemble their biological siblings. If you have a brother or a sister, both of you have inherited half of your DNA from each of your parents. The vast majority of this DNA, which is both a large molecule with billions of nucleotide bases and something like software code for a biological computer, is extremely stable. Very rarely, mistakes can occur during the process of meiosis and these mistakes are occasionally passed on to offspring, so the good news here is that you’re not exactly like your parents! The better news from the standpoint of genetics is that these mistakes, which are referred to as mutations, provide a record of descent from common ancestors. As biologists, we can read this record in a manner that is similar to how a paleontologist would make inferences about how an extinct species may have lived. By the end of this book, you will be able to read this record for yourself using data collected from millions of samples and thousands of species. In the process of doing this, you’ll learn about genetics, computer code, and biodiversity.
 Figure 1A: Genetic data (i.e., DNA sequences) contain a great deal of information about an organisms's past. Figure created by Abbie Zimmer.
The goals of our phylogatR project are simple: we want to empower students to actively learn about genetics, computer code, and biodiversity by repurposing genetic and climatic data that cost millions of dollars and decades of hard work by thousands of scientists to acquire. We hope to highlight basic scientific research in a discipline that is fundamentally about global change. In the process of reading this book, working through the exercises, and designing your own research studies, you’ll learn important skills and techniques in the data sciences that are applicable to any of a number of professions. We hope to convince you that the conservation of biodiversity is one of the most pressing issues facing people today, that this issue is exacerbated by climate change, and that we must value this irreplaceable natural resource before it goes extinct. Let’s get started!
1.1 How to use this book
Each chapter will introduce you to a topic that uses genetic data to understand biodiversity. It is not meant to serve as a genetics textbook, but as a refresher for those that are already familiar with topics in genetics or a very basic introduction. This book builds on itself but does need to be used in its entirety or sequentially. However, you will want to read Chapter 4 Biodiversity databases in order to understand the data being used throughout the book.
At the end of each chapter there will be hands-on practice that use phylogatR. For each exercise you can choose to walk through the R modules and learn how to code! Or you can use the graphical user interface (GUI) and click the buttons to use the data.
1.2 Prerequisites if using R
1.2.1 R and RStudio
R is a language and environment for statistical computing and graphics.
RStudio is a set of integrated tools designed to help you be more productive with R.
You will need to install R and RStudio on your computer. See here for instructions.
1.2.2 R packages
You will need to load R packages in order to obtain the functions necessary for the analyses that will be conducted throughout this book. If you have not already installed the called-for packages designated in the practice sessions, you will need to do that first. See here for more information on package installation in R. In short, you will install R packages using the install.packages() function. You only need to install packages once on your computer, but you need to load the library every time you open a new R session.
1.2.2.1 Running R code
Everything in grey boxes is R code or output. To run the code, you can copy and paste the code into the R console from which you are working. Lines of text within the grey boxes that start with # and are blue, are comments for the code and ignored by R. Output will follow in a second grey box and begin with ##.
#here is an example of R code
y <- 2 + 2
y
## [1] 4